Class Survey
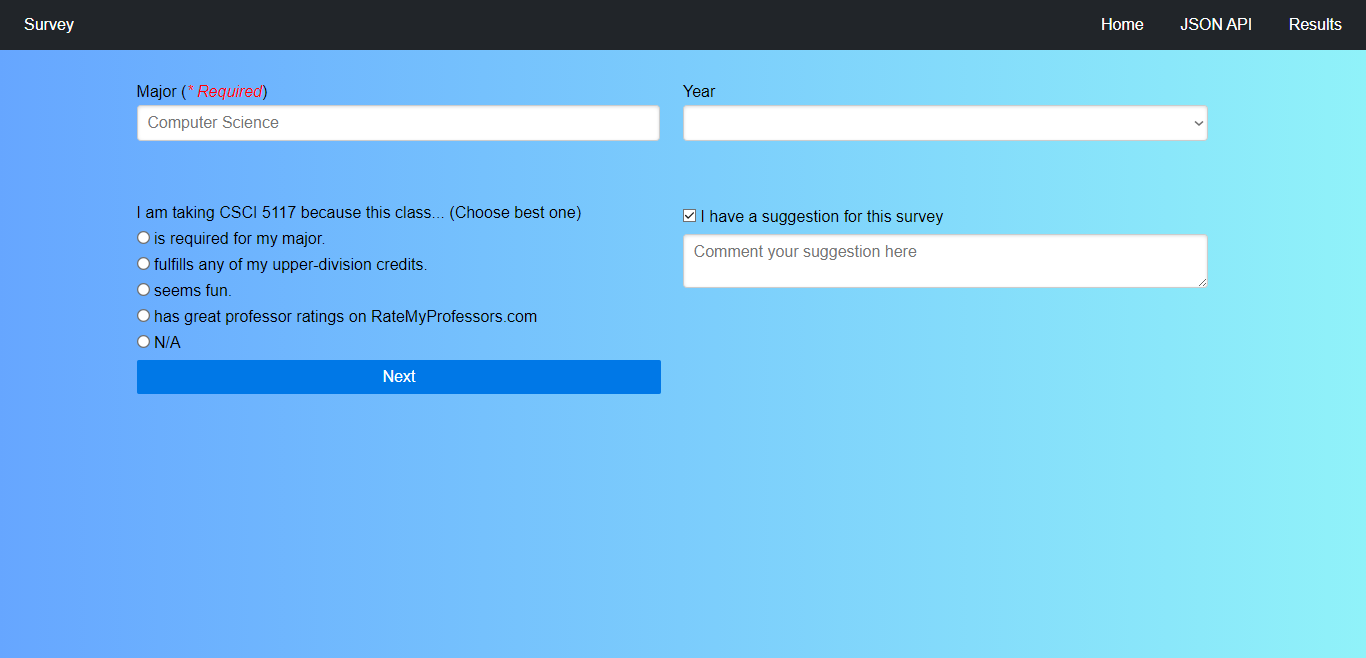
The core purpose of this project is to demonstrate the lessons learned from the CSCI 5117 class (Developing the Interactive Web) by using Flask/Jinja, API, Chart.js, PostgreSQL, Heroku, and Pure.css to create a survey for CSCI 5117 students to gauge why they are interested in taking this course. For one of the core implementations, users must fill out the survey with their major in the textbox. Additionally, they may also want to select the year that they are currently in college, as well as select the reason why they’re taking CSCI 5117. If they have any suggestions about the site, they may click on the “I have a suggestion for this survey” checkbox to fill out the suggestion.

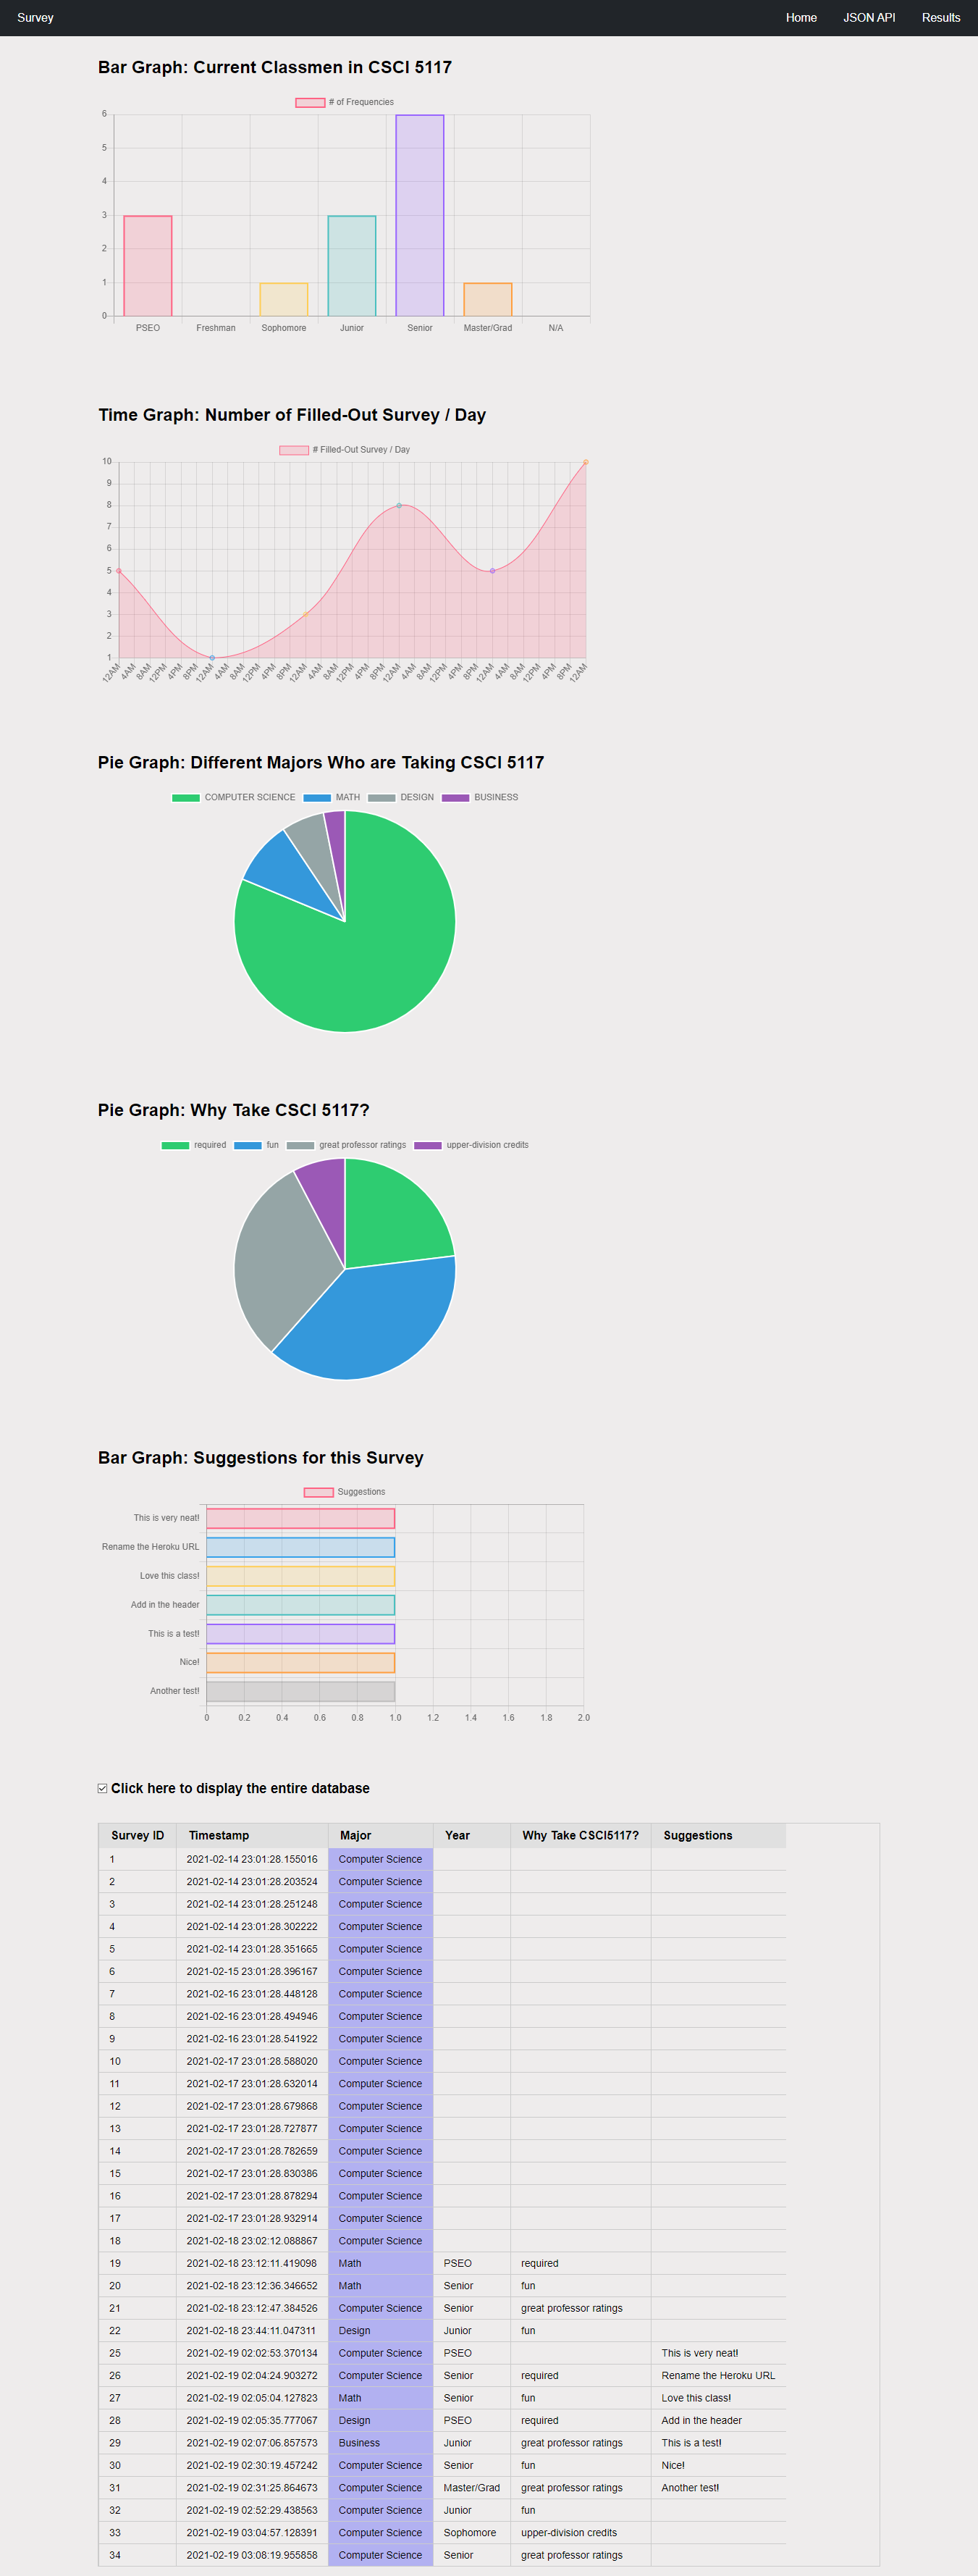
Once the survey has been filled out, the page informs the user if they would like to view the summary page, which uses the Chart.js library, where the page shows the bar and pie graphs of the overall results from everyone’s surveys. The graphs show what year the current students are in, the number of surveys filled out each day, the majors who are taking CSCI 5117, and the reasons why they are taking CSCI 5117. Furthermore, the user may click the checkbox on the bottom of the page if they wish to display the entire database, which shows every field/document that was collected when the user submitted their survey.

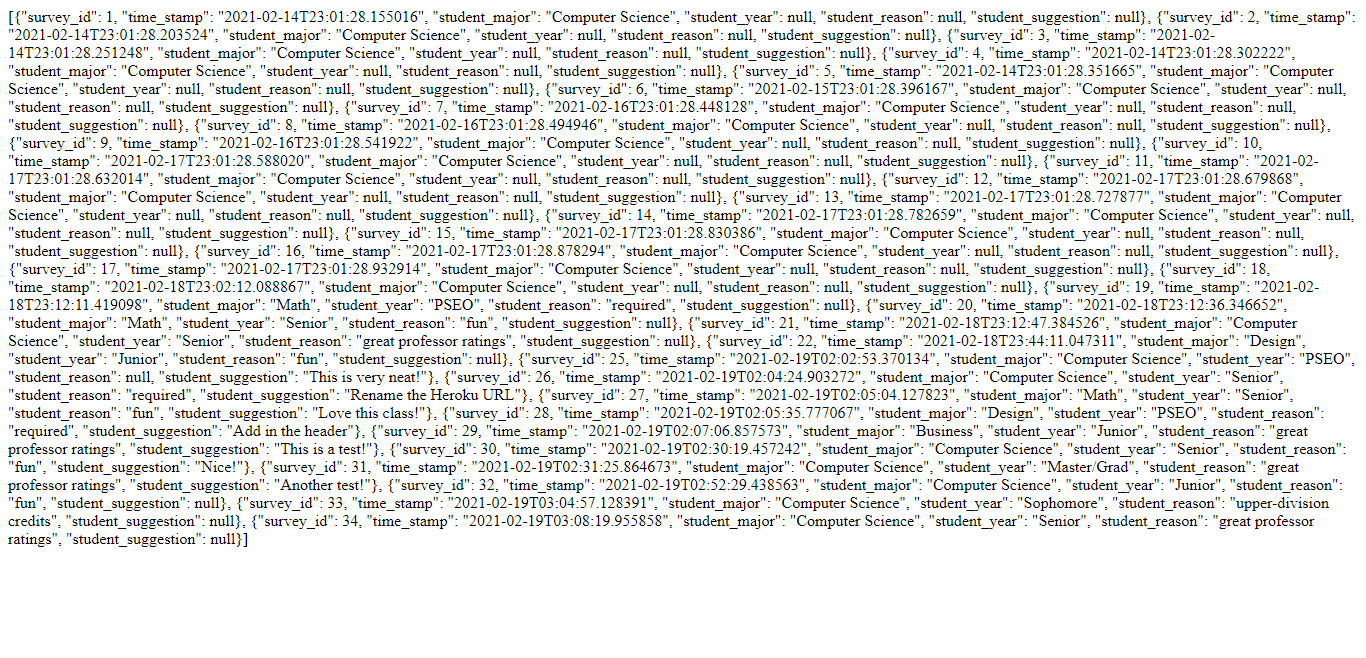
Another core component of the site is to create an API endpoint that returns a JSON representation of all the survey responses that the site has collected to date. By default, it should return all responses in natural order by primary key. However, it also supports a query parameter ?reverse=true by sorting the database collections by the most recent survey.

If you would like to run or to learn more about this project, please check out the links below.
Class Survey Links
- Repository
- Live website (may load a bit slow at first)